

Sales Performance Free Vector Illustration
Sales Performance Free Vector Illustration The free vector illustration can be customized to fit any brand or message, and can be used to promote a wide range of sales-related events or promotions. By incorporating the illustration into your marketing efforts, you can increase engagement, drive traffic to your website or social media pages, and promote a positive image of your brand as a sales leader.
Attributes
Size Resizable
File Format EPS,SVG,JPEG
Software Adobe Illustrator
Author
NinthMotion
OR
Discover Similar Templates
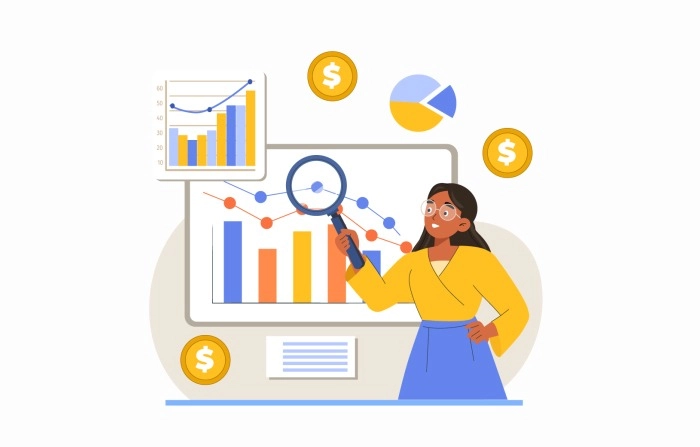
Sales performance illustration is a visual representation of the sales performance of a company or a sales team over a specific period of time. It typically includes graphs, charts, and other visual aids that show the key sales metrics such as revenue, units sold, profit margin, customer acquisition, and retention rates.

This Sales Performance Graph Illustration represents the growth and progress of a company's sales over time. The graph showcases a steady increase in sales, with each point on the line representing a specific period.

A vector illustration depicts a young professional woman analyzing a sales performance graph in a business setting, focusing on growth and improvement. The character appears confident and engaged, with business environments and visuals highlighting her role in sales optimization.

A 2D vector illustration of a female character interacting with a sales performance graph is commonly used in business contexts to represent sales analysis, performance tracking, and business success, using clean lines and vibrant colors.
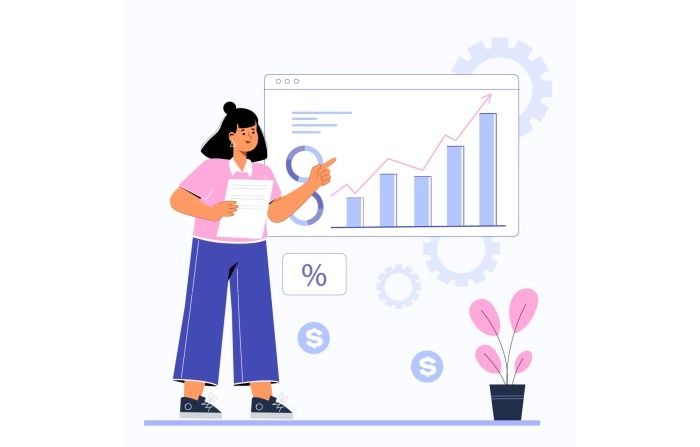
This vector illustration features a girl explaining the sales performance to her colleague or team members. The girl is standing in front of a whiteboard or a screen, pointing at the graph or chart that represents the sales performance. She is wearing professional attire, with a blazer and a skirt, indicating that she is a business professional.
A flat character illustration of a girl explaining sales performance could depict a young woman in business attire, standing in front of a chart or graph that displays sales data. The illustration would aim to highlight the character's ability to communicate and analyze sales performance.
Sales performance illustration is a visual representation of the sales performance of a company or a sales team over a specific period of time. It typically includes graphs, charts, and other visual aids that show the key sales metrics such as revenue, units sold, profit margin, customer acquisition, and retention rates.
This Sales Performance Graph Illustration represents the growth and progress of a company's sales over time. The graph showcases a steady increase in sales, with each point on the line representing a specific period.
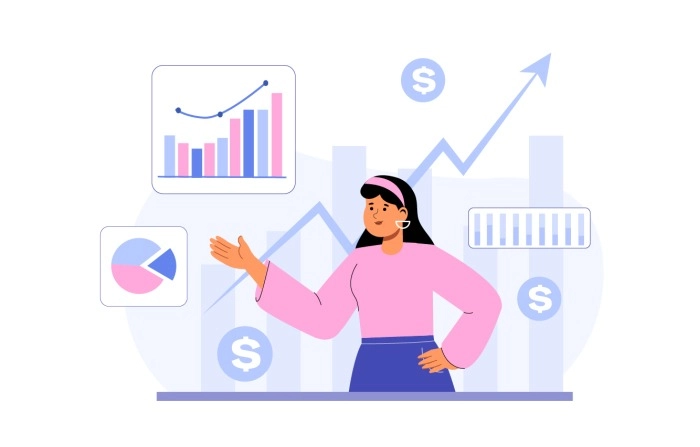
A vector illustration depicts a young professional woman analyzing a sales performance graph in a business setting, focusing on growth and improvement. The character appears confident and engaged, with business environments and visuals highlighting her role in sales optimization.
A 2D vector illustration of a female character interacting with a sales performance graph is commonly used in business contexts to represent sales analysis, performance tracking, and business success, using clean lines and vibrant colors.
This vector illustration features a girl explaining the sales performance to her colleague or team members. The girl is standing in front of a whiteboard or a screen, pointing at the graph or chart that represents the sales performance. She is wearing professional attire, with a blazer and a skirt, indicating that she is a business professional.
A flat character illustration of a girl explaining sales performance could depict a young woman in business attire, standing in front of a chart or graph that displays sales data. The illustration would aim to highlight the character's ability to communicate and analyze sales performance.