
Transform Your Creative Work: Start Today with Our graphics design sales performance graph Illustrations
Explore the ultimate collection of graphics design sales performance graph Illustrations to transform your brand visuals. Dive into a world of premium designs that are both trendy and effortless to use. Elevate your video projects with our captivating templates and make your brand stand out.
Total Results: 80
Filter By:
all

The Confident Man Displaying Sales Performance Graph Illustration Template showcases a skilled man showcasing his impressive sales performance through a graph. Its dynamic aesthetics, clean lines, and attention to detail highlight sales expertise and professionalism.

A flat character design illustrates a professional man with a sales growth graph, showcasing his positive sales performance. The illustration features him in a business setting, wearing professional attire, and demonstrating his contribution to sales growth.

A 2D vector illustration of a female character interacting with a sales performance graph is commonly used in business contexts to represent sales analysis, performance tracking, and business success, using clean lines and vibrant colors.

A vector illustration depicts a young professional woman analyzing a sales performance graph in a business setting, focusing on growth and improvement. The character appears confident and engaged, with business environments and visuals highlighting her role in sales optimization.

This Sales Performance Graph Illustration represents the growth and progress of a company's sales over time. The graph showcases a steady increase in sales, with each point on the line representing a specific period.

A "Flat Character Man Data Analysis and Sales Performance Graph Illustration" depicts a male character in a business setting, analyzing data and making informed decisions, often accompanied by charts and data visualizations, for various business applications.

Sales performance illustration is a visual representation of the sales performance of a company or a sales team over a specific period of time. It typically includes graphs, charts, and other visual aids that show the key sales metrics such as revenue, units sold, profit margin, customer acquisition, and retention rates.

A flat character illustration of a girl explaining sales performance could depict a young woman in business attire, standing in front of a chart or graph that displays sales data. The illustration would aim to highlight the character's ability to communicate and analyze sales performance.

The Confident Man Representing Sales Performance Flat Character Illustration showcases a skilled, confident man showcasing exemplary sales performance. Its dynamic aesthetics, clean lines, and attention to detail make it a versatile tool for presentations, websites, and marketing campaigns.

This vector illustration features a girl explaining the sales performance to her colleague or team members. The girl is standing in front of a whiteboard or a screen, pointing at the graph or chart that represents the sales performance. She is wearing professional attire, with a blazer and a skirt, indicating that she is a business professional.

A boy explaining sales performance character illustration template would typically feature a cartoon-style character that represents a salesperson or team leader.

A "Sales Performance Graph with the Male Character Illustration" depicts a male character in a business setting, analyzing sales data and making data-driven decisions. This illustration is commonly used in business reports, presentations, and marketing materials.

Sales Performance Free Vector Illustration The free vector illustration can be customized to fit any brand or message, and can be used to promote a wide range of sales-related events or promotions. By incorporating the illustration into your marketing efforts, you can increase engagement, drive traffic to your website or social media pages, and promote a positive image of your brand as a sales leader.

A template for an illustration of a girl analyzing sales performance could be a depiction of a girl sitting at a desk or standing in front of a chart or graph, with a laptop or tablet in front of her.
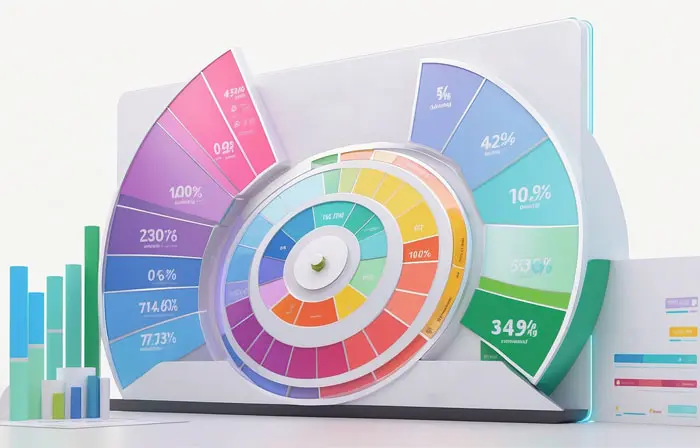
Visualize your data in style with this dynamic 3D design model illustration template featuring a round infographic in a colorful style. Each segment of the infographic bursts with vibrant hues and eye-catching patterns, creating a visually appealing display of information. Whether it's statistical data, progress indicators, or key points, this template allows you to present your content in a dynamic and engaging way.
Showing 1-15 of 80
create a design in No time with our premium design assets
Personal Use License
24/7 customer support
Unlimited Pro design files
Content On Demand
80 premium items per month
Unlimited Free design files
20 premium items daily
Exclusive content
3D And CGI VFX Assets