

Market Trends Infographic Analyzing Man 3D Character Image Illustration
A 3D character image illustration for a market trends infographic depicts a professional analyzing market trends, interacting with data visualizations, charts, and graphs. The illustration uses financial charts, financial indicators, and textures to convey the analytical process effectively.
Attributes
After Effects Version CC
Category Illustration
Resolution Resizable
Author
NinthMotion
OR
Discover Similar Templates

A 3D character image illustration of a woman analyzing market trends in an office setting is created, showcasing her analytical process and incorporating data visualizations, charts, and graphs to convey the concept of market research effectively.

A 3D illustration depicts a woman in a professional setting, analyzing stock market trends. She is dressed professionally, examining charts, graphs, and financial reports. The character's focus is on financial data analysis, highlighting her expertise in the market.

The 3D illustration depicts a man in a sophisticated workspace analyzing stock market trends, showcasing his expertise in financial analysis and investment strategies. The man is dressed professionally, presenting graphs, charts, and statistics on a large monitor, showcasing his commitment to understanding market trends.
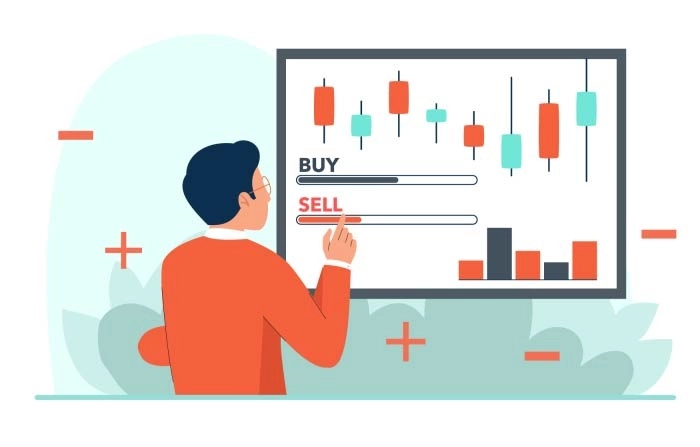
Learn the art of analyzing candlestick charts in the stock market as a trader. This comprehensive guide provides insights into reading and interpreting candlestick patterns, helping you make informed investment decisions. Master the skills needed to navigate the complexities of stock market trends and enhance your trading strategies.

The illustration depicts two young girls studying stock market trends in a flat design, demonstrating their collaboration and knowledge-sharing. The background includes financial symbols and symbols, showcasing their interest in finance and investments.

A 3D character illustration depicts professional women analyzing stock market growth, showcasing their expertise in financial analysis. The illustration uses computer screens, economic indicators, and realistic office environments, incorporating financial charts, graphs, and business indicators to emphasize their role.
A 3D character image illustration of a woman analyzing market trends in an office setting is created, showcasing her analytical process and incorporating data visualizations, charts, and graphs to convey the concept of market research effectively.
A 3D illustration depicts a woman in a professional setting, analyzing stock market trends. She is dressed professionally, examining charts, graphs, and financial reports. The character's focus is on financial data analysis, highlighting her expertise in the market.
The 3D illustration depicts a man in a sophisticated workspace analyzing stock market trends, showcasing his expertise in financial analysis and investment strategies. The man is dressed professionally, presenting graphs, charts, and statistics on a large monitor, showcasing his commitment to understanding market trends.
Learn the art of analyzing candlestick charts in the stock market as a trader. This comprehensive guide provides insights into reading and interpreting candlestick patterns, helping you make informed investment decisions. Master the skills needed to navigate the complexities of stock market trends and enhance your trading strategies.
The illustration depicts two young girls studying stock market trends in a flat design, demonstrating their collaboration and knowledge-sharing. The background includes financial symbols and symbols, showcasing their interest in finance and investments.
A 3D character illustration depicts professional women analyzing stock market growth, showcasing their expertise in financial analysis. The illustration uses computer screens, economic indicators, and realistic office environments, incorporating financial charts, graphs, and business indicators to emphasize their role.