
Data Analysis Concept Animation Scene
Discover the power of data analysis through an engaging concept animation scene. Explore the process of extracting valuable insights from complex datasets, visualizing trends, and making data-driven decisions.
Attributes
Resolution 1920x1080
Video Encoding ProRes
Number of Clips 1
Author
NinthMotion
OR
Discover Similar Templates
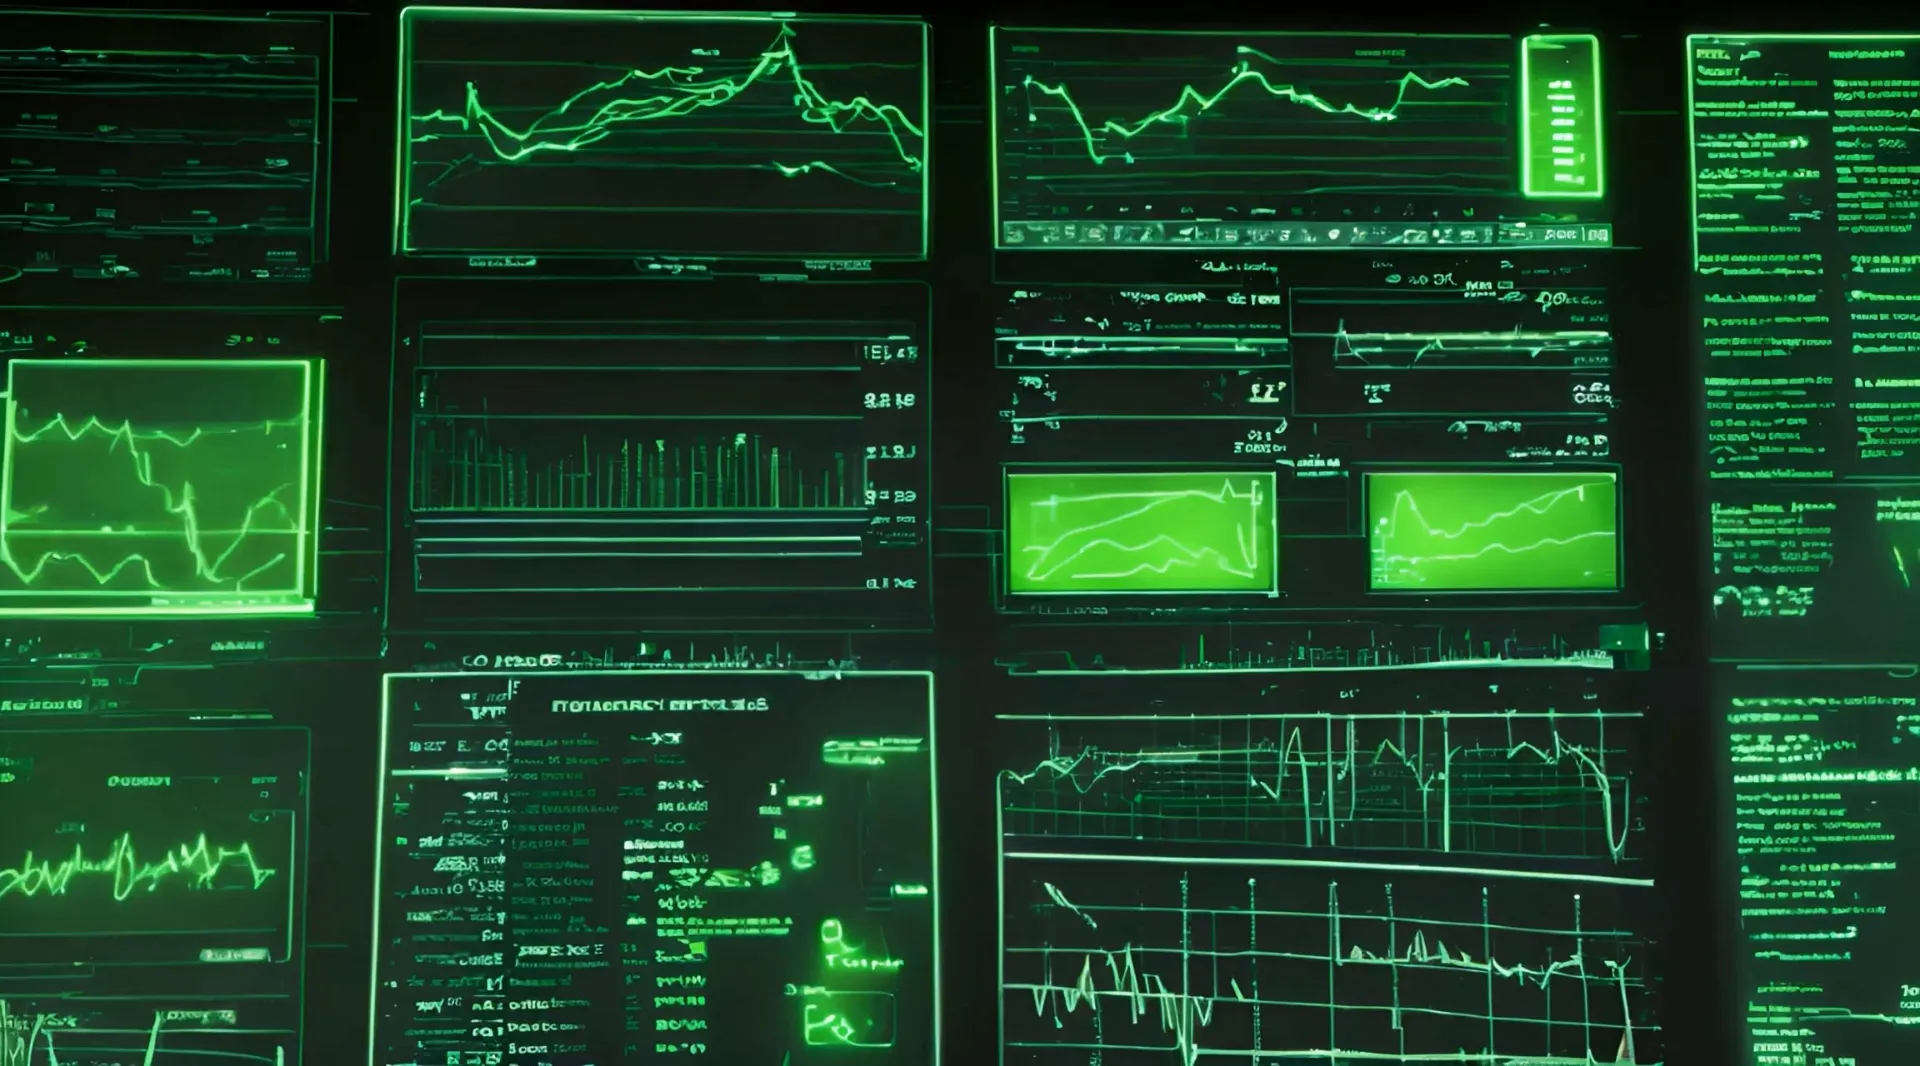
Elevate your data insights with our Tech Analytics Modern Data Visualization solution. Transform complex datasets into visually stunning and easily understandable graphics, empowering your team to make informed decisions and uncover valuable insights in the rapidly evolving tech landscape.

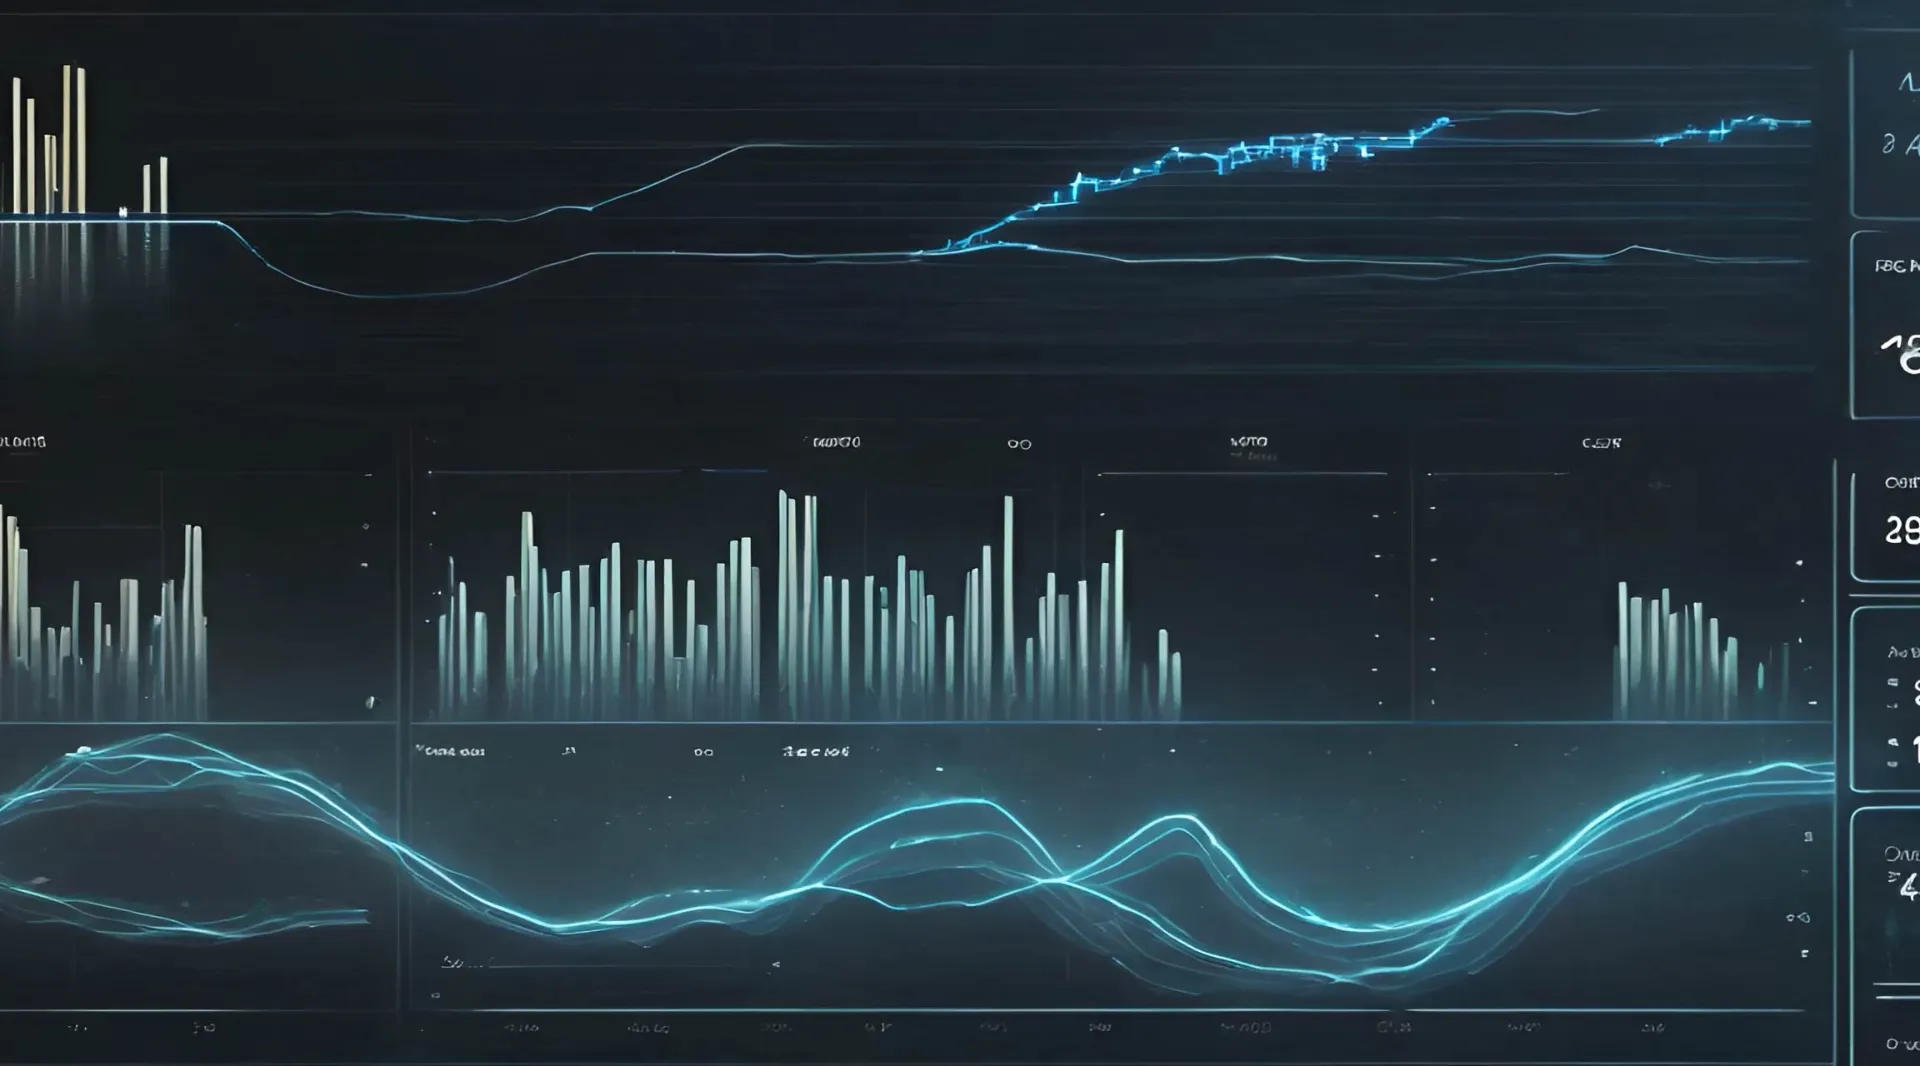
The data analysis animation scene is a visually stunning and informative motion graphics piece that showcases the process of data analysis. Using clean and modern graphics, the animation takes the viewer on a journey through the steps of data analysis.
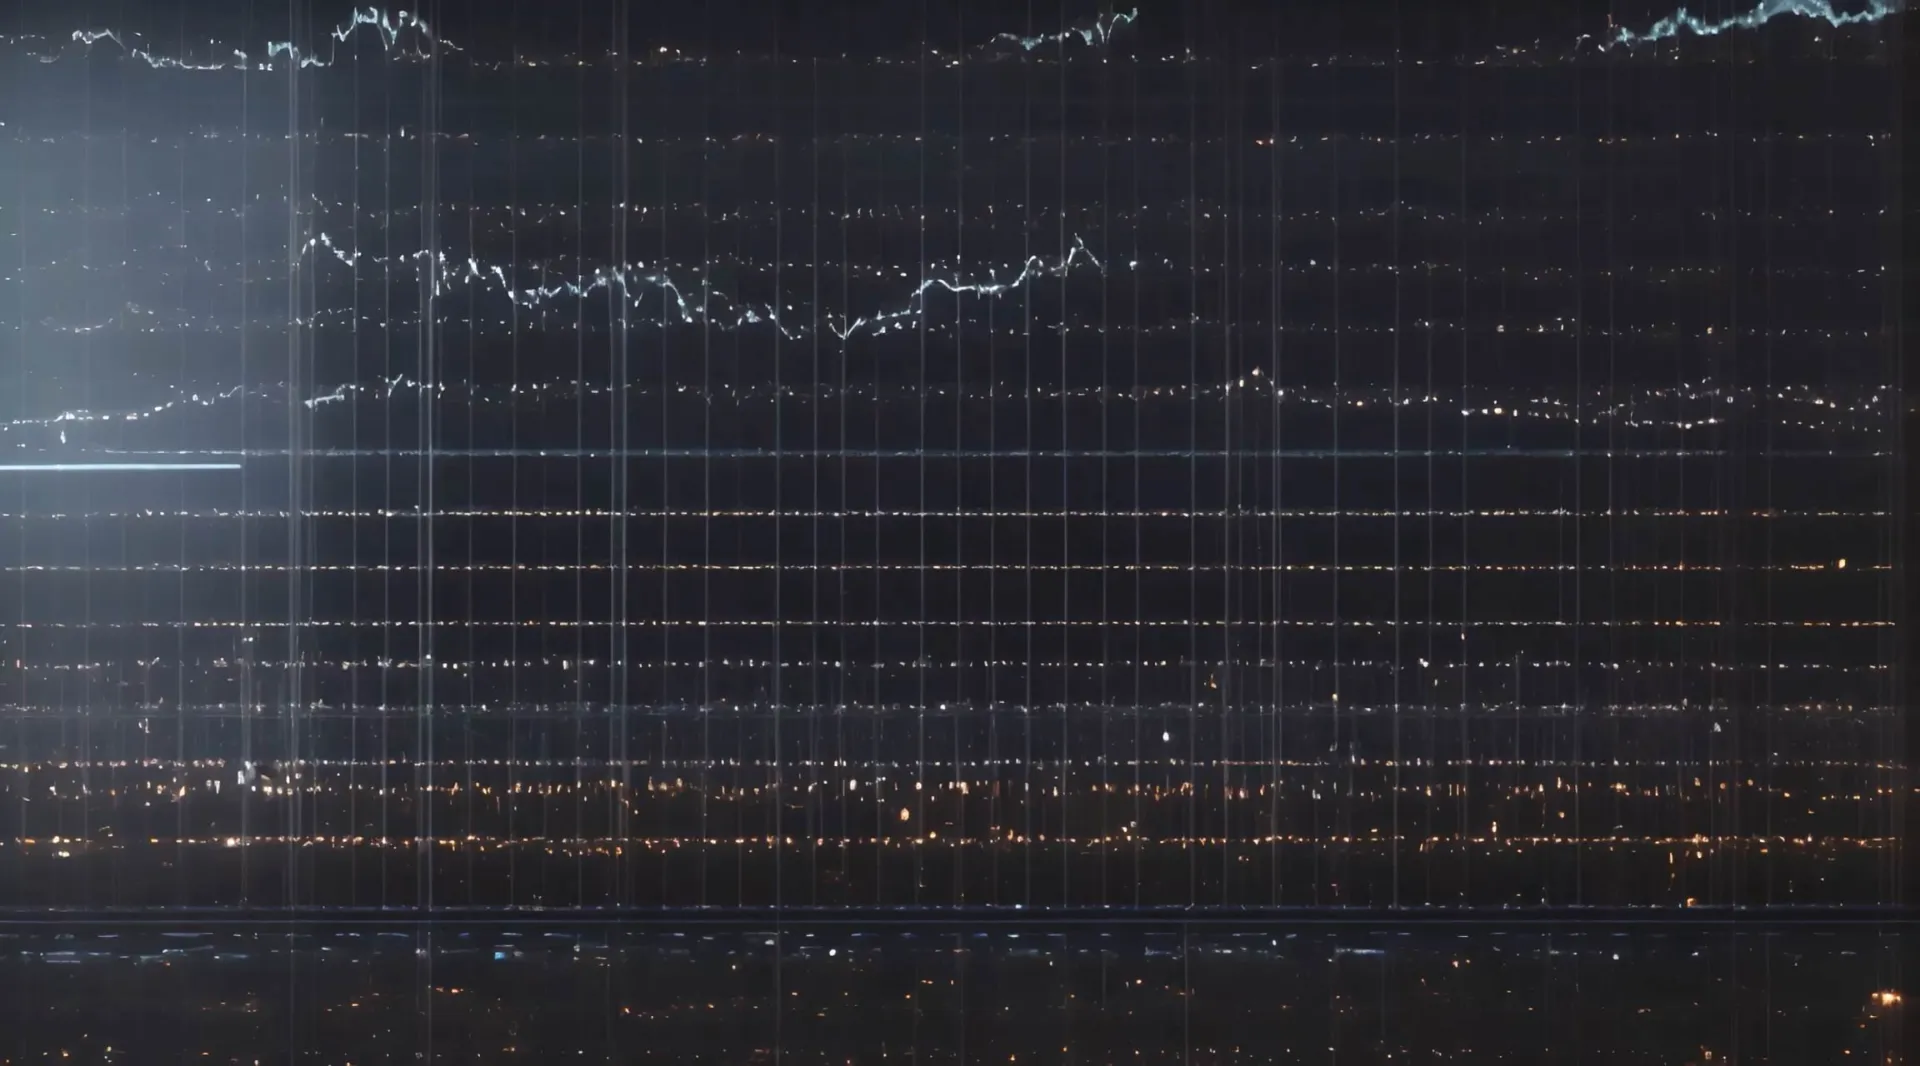
Dive into the heart of information with our Data Matrix Digital Dashboard Backdrop. Watch as data streams converge and flow, forming intricate patterns across the digital landscape. Immerse yourself in this dynamic scene, perfect for visualizing complex data sets and showcasing the power of analytics in presentations or projects.
Unlock the future of data with our Futuristic Data Analysis Video Backdrop. Dive into a digital landscape where streams of information converge and unfold in a mesmerizing display of technology and innovation. Perfect for projects seeking to convey the power and sophistication of modern data analysis techniques, this backdrop sets the stage for dynamic presentations and captivating visuals.
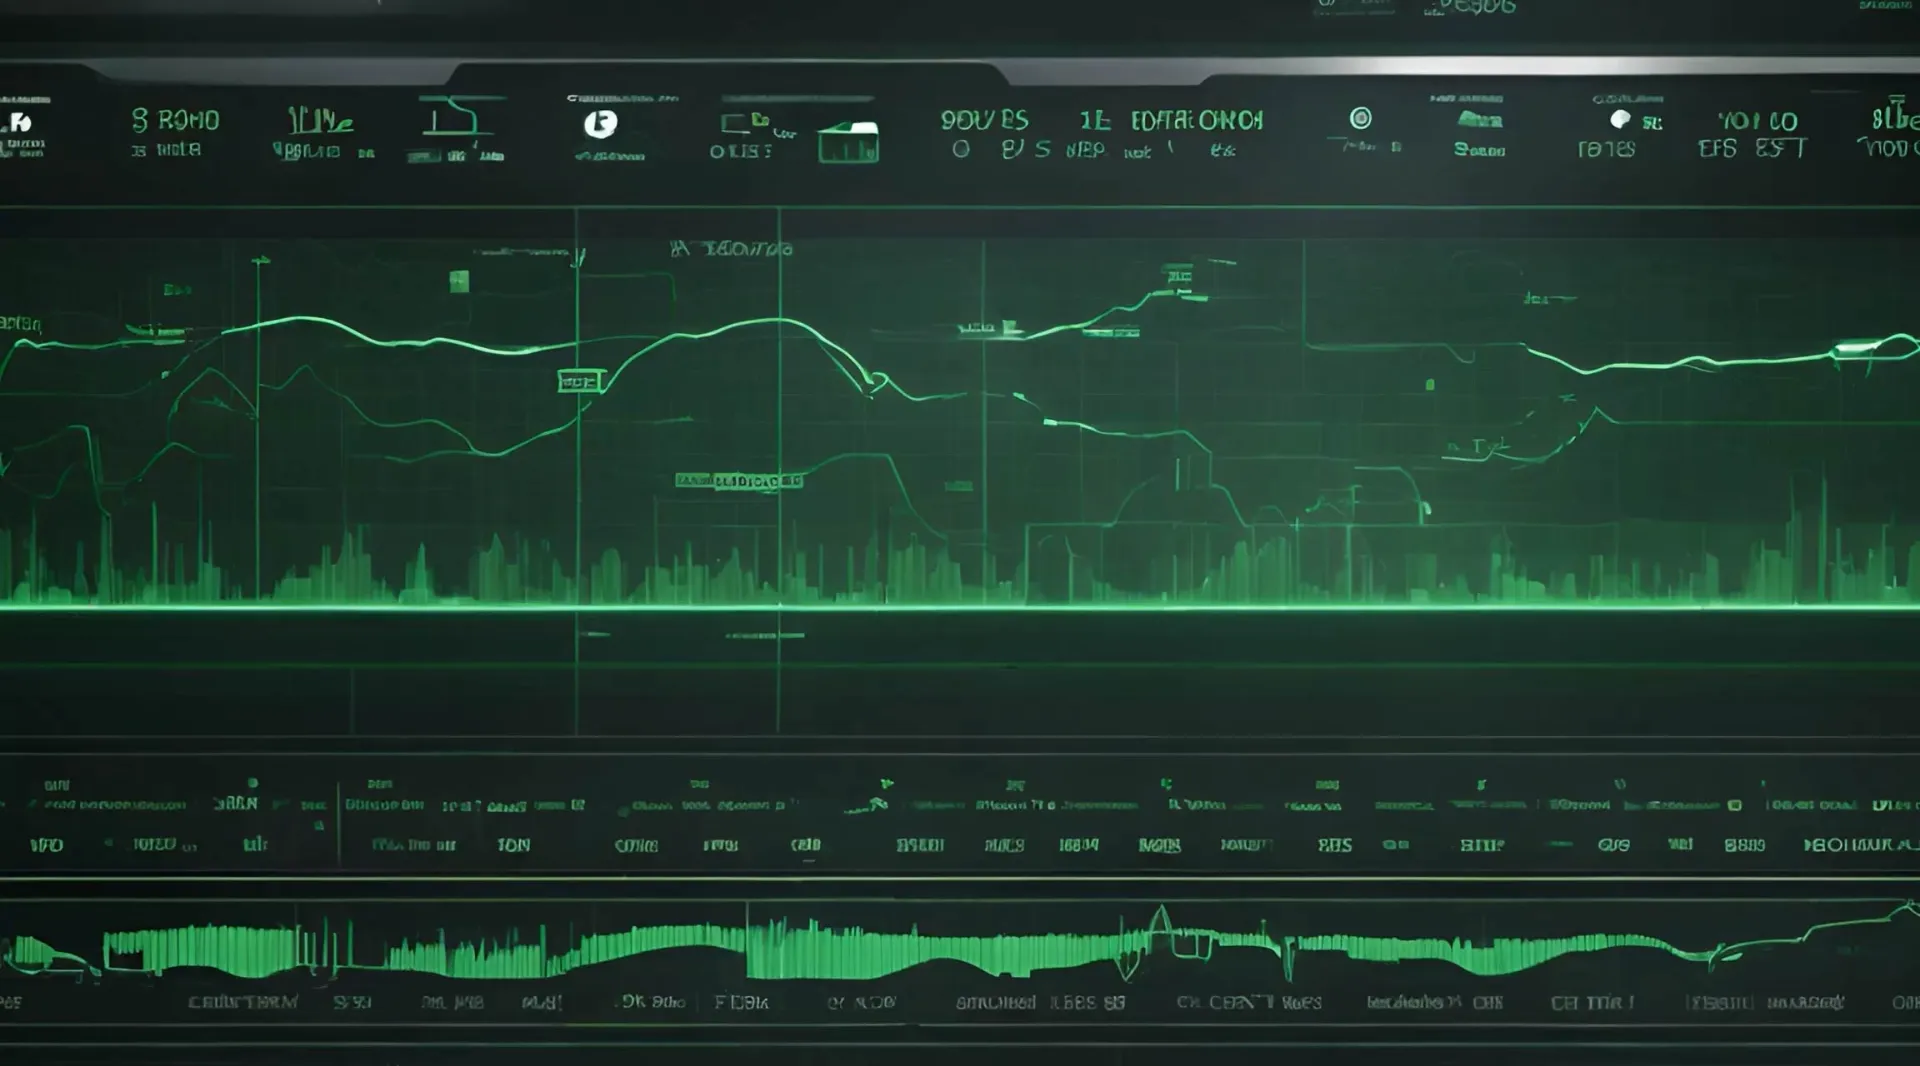
Step into the future of data analysis with our Futuristic Data Analysis Interactive Dashboard video. Immerse yourself in the dynamic interface of tomorrow, where sleek graphics and intuitive controls converge to unlock insights with unprecedented ease. Explore the possibilities of interactive data visualization as this captivating video showcases the cutting-edge of analytical technology.

The scene you are describing is likely a visualization or depiction of data analysis being performed on a female character, such as in a digital or animated context. This could involve the use of various graphical elements, such as charts, graphs, or diagrams, to represent different aspects of the character's attributes, behavior, or personality traits.
Elevate your data insights with our Tech Analytics Modern Data Visualization solution. Transform complex datasets into visually stunning and easily understandable graphics, empowering your team to make informed decisions and uncover valuable insights in the rapidly evolving tech landscape.
The data analysis animation scene is a visually stunning and informative motion graphics piece that showcases the process of data analysis. Using clean and modern graphics, the animation takes the viewer on a journey through the steps of data analysis.
Dive into the heart of information with our Data Matrix Digital Dashboard Backdrop. Watch as data streams converge and flow, forming intricate patterns across the digital landscape. Immerse yourself in this dynamic scene, perfect for visualizing complex data sets and showcasing the power of analytics in presentations or projects.
Unlock the future of data with our Futuristic Data Analysis Video Backdrop. Dive into a digital landscape where streams of information converge and unfold in a mesmerizing display of technology and innovation. Perfect for projects seeking to convey the power and sophistication of modern data analysis techniques, this backdrop sets the stage for dynamic presentations and captivating visuals.
Step into the future of data analysis with our Futuristic Data Analysis Interactive Dashboard video. Immerse yourself in the dynamic interface of tomorrow, where sleek graphics and intuitive controls converge to unlock insights with unprecedented ease. Explore the possibilities of interactive data visualization as this captivating video showcases the cutting-edge of analytical technology.
The scene you are describing is likely a visualization or depiction of data analysis being performed on a female character, such as in a digital or animated context. This could involve the use of various graphical elements, such as charts, graphs, or diagrams, to represent different aspects of the character's attributes, behavior, or personality traits.