
EXCLUSIVE OFFER
Enjoy 50% off on all purchases and subscriptions, available with any payment method!
Discover default graphics business charts design Templates- See What's New on Page 3
Explore the ultimate collection on 3 of default graphics business charts design to transform your brand visuals. Dive into a world of premium designs that are both trendy and effortless to use. Elevate your video projects with our captivating templates and make your brand stand out.
Filter By:
all
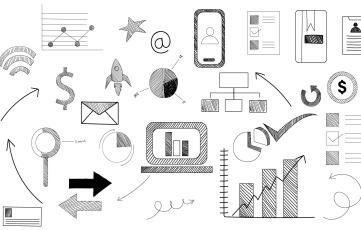
Discover a collection of premium vector business doodle elements that will take your branding to the next level. These versatile illustrations are perfect for adding a touch of creativity and professionalism to your marketing materials.

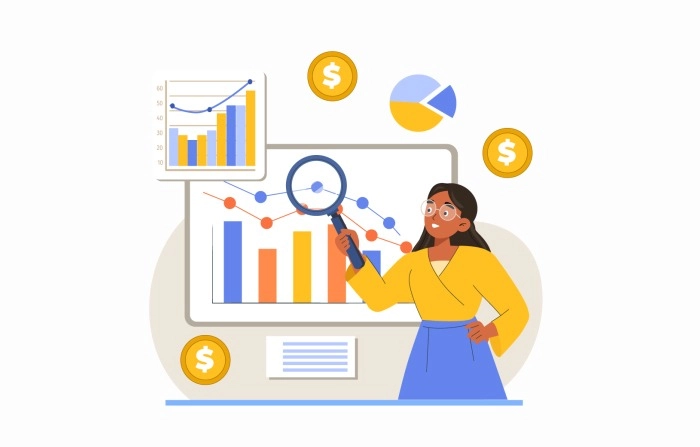
A flat art character illustration depicts professional characters in a creative business planning session, showcasing their innovative thinking and teamwork. The scene includes charts, graphs, and visual aids, with diverse traits and attire reflecting their roles.

Create a visually appealing 2D business infographic for social media marketing, featuring vibrant colors, sleek design elements, and easy-to-read typography. Emphasize user engagement with dynamic elements, graphs, charts, and illustrative elements for comprehensibility and professionalism.

This Sales Performance Graph Illustration represents the growth and progress of a company's sales over time. The graph showcases a steady increase in sales, with each point on the line representing a specific period.

In this flat design illustration, a woman in business attire is depicted examining data on her laptop. She is shown sitting at a desk, with her laptop open and displaying charts, graphs, or other data visualizations. The woman appears focused and engaged as she analyzes the information on the screen, indicating her involvement in business analysis or decision-making processes. The illustration conveys a sense of professionalism and competence, highlighting the importance of data-driven approaches in modern business practices.
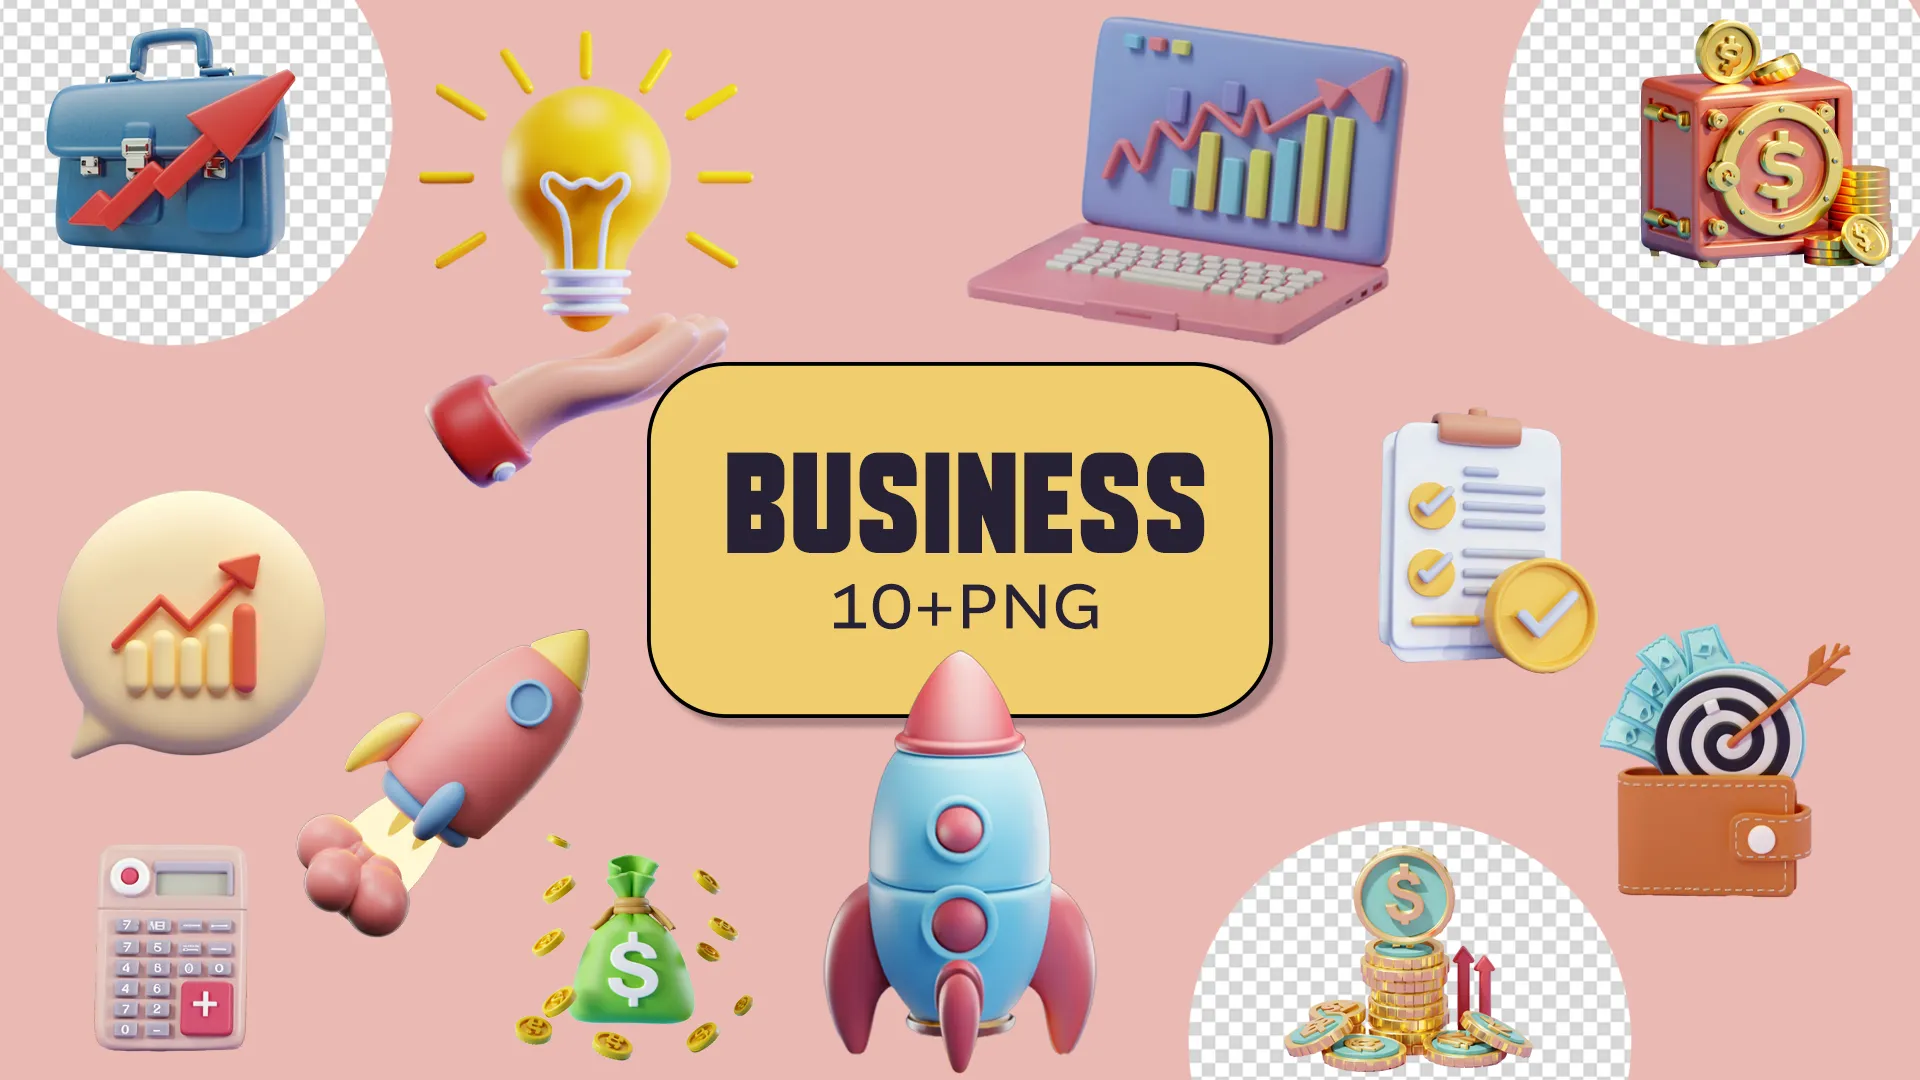
Unlock the potential for financial growth and success with our Business Analysis 3D Pack, meticulously designed to drive strategic insights and empower decision-making! Immerse yourself in a world of dynamic visuals with meticulously crafted 3D models of financial charts, graphs, and analytical tools. Whether you're conducting market research, evaluating performance metrics, or forecasting future trends, these versatile assets add depth and clarity to your business analysis.
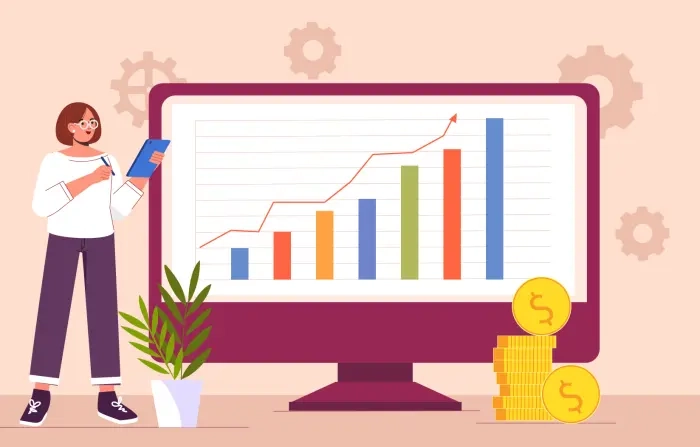
A 2D vector illustration of a female character interacting with a sales performance graph is commonly used in business contexts to represent sales analysis, performance tracking, and business success, using clean lines and vibrant colors.

The E-Mail Marketing Online Business Illustration is a comprehensive resource designed to help you unlock the power of e-mail marketing for your online business
Sales performance illustration is a visual representation of the sales performance of a company or a sales team over a specific period of time. It typically includes graphs, charts, and other visual aids that show the key sales metrics such as revenue, units sold, profit margin, customer acquisition, and retention rates.

This flat design character illustration celebrates business success with enthusiasm and accomplishment. The character wears a professional outfit, symbolizing achievement. The illustration features a rising chart, gold coins, and a champagne bottle, surrounded by dynamic colors.

Explore a wide range of stunning vector illustrations for your e-commerce business online shopping needs. Enhance your website or promotional materials with high-quality stock illustrations designed specifically for e-commerce businesses.

In this vector stock illustration, innovative business planning and growth are depicted through various elements symbolizing creativity and progress. The illustration features dynamic imagery such as charts, graphs, and arrows representing data analysis and strategic planning. Additionally, symbols of innovation like lightbulbs or gears are incorporated to signify creativity and forward-thinking approaches. The illustration portrays a sense of momentum and advancement, capturing the essence of a business poised for growth through innovative strategies and planning.
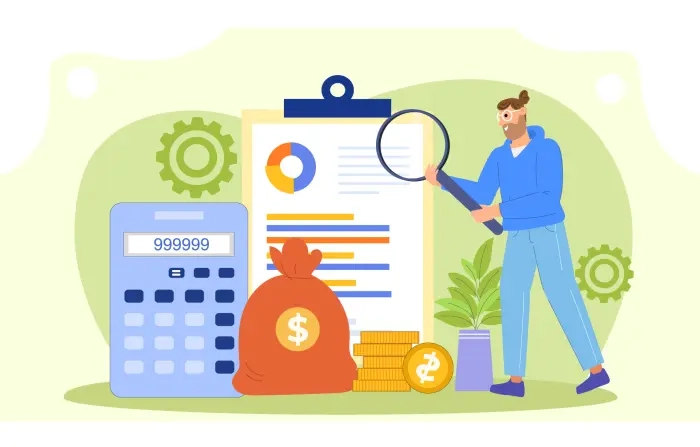
The 2D vector illustration depicts a professional corporate financial planning man, surrounded by financial charts and graphs, demonstrating the importance of precision and strategic thinking in financial matters.

Credit Card Online Shopping Illustration, a captivating and visually engaging depiction of the modern and convenient way we shop in the digital age. This illustration beautifully captures the essence of online shopping, showcasing the seamless integration of credit cards as a secure and popular payment method.
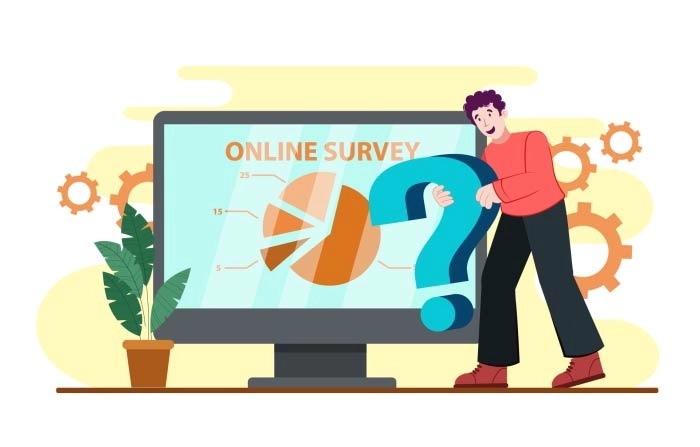
Consider incorporating illustrations into your survey design. Illustrations have a powerful impact on participants, capturing their attention and conveying information in a visually appealing way. In this article, we will explore the benefits of using illustrations in online surveys and provide practical tips on how to create effective survey illustrations.
create a design in No time with our premium design assets
Personal Use License
24/7 customer support
Unlimited Pro design files
Content On Demand
80 premium items per month
Unlimited Free design files
20 premium items daily
Exclusive content
3D And CGI VFX Assets