
EXCLUSIVE OFFER
Enjoy 50% off on all purchases and subscriptions, available with any payment method!
Discover free graphics progress chart analysis design Templates- See What's New on Page 6
Explore the ultimate collection on 6 of free graphics progress chart analysis design to transform your brand visuals. Dive into a world of premium designs that are both trendy and effortless to use. Elevate your video projects with our captivating templates and make your brand stand out.
Filter By:
free

This email marketing flat character and statistical infographics illustration visually represents the dynamic world of email marketing, featuring diverse characters representing roles and metrics. The combination of characters and infographics highlights the human and data-driven aspects of the industry.
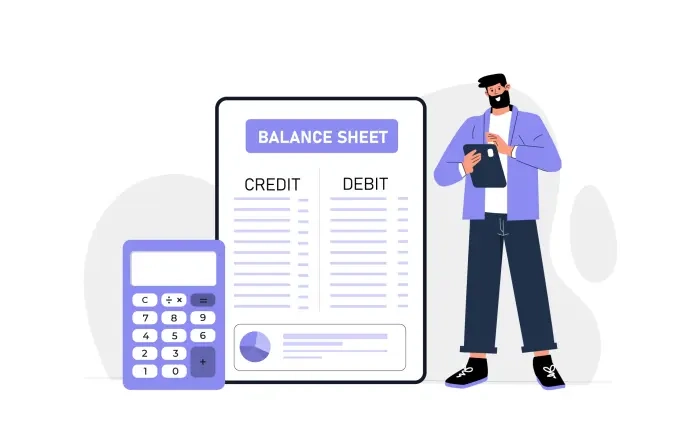
Illustrate financial stability and control with our stock illustration featuring a conceptual character interacting with a finance balance sheet. This dynamic graphic visually communicates the idea of managing financial resources and maintaining a balanced financial portfolio. Ideal for presentations, reports, or articles related to finance and accounting, this illustration adds a professional and engaging touch to your content. Elevate your visual storytelling by incorporating this balanced and insightful character stock illustration into your finance-related materials.

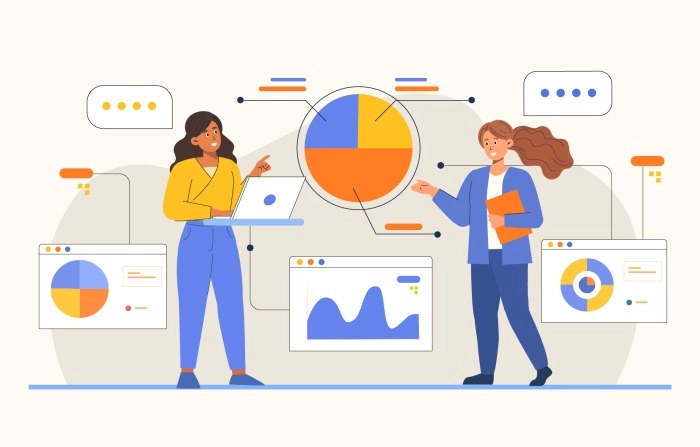
The Business Planning Corporate Strategy Team Character Illustration showcases diverse professionals in a strategic planning session, showcasing the power of collaboration and diverse perspectives. Its professional aesthetics and attention to detail make it a versatile visual tool for presentations, websites, and marketing campaigns.
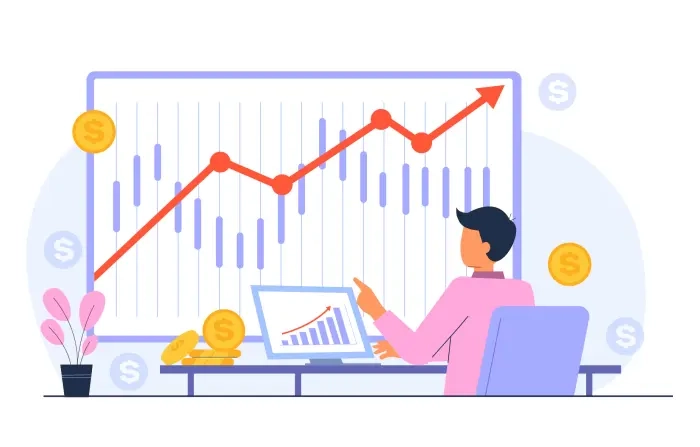
Stock Market Monitoring Character Illustration. This eye-catching and informative graphic showcases real-time stock market data and trends, providing a visual representation of market performance. Engage your audience with dynamic illustrations that bring financial data to life.

Marketing strategy with our captivating social media business marketing vector illustration. Attract new buyers, retain loyal clients, and accelerate your business growth. Get noticed in the digital landscape and stay ahead of the competition.
Office Management Illustration Get a clear and comprehensive understanding of office management with our detailed illustrations. Our visual guide provides an overview of the fundamentals, exploring best practices, processes, and strategies to help you manage a productive workplace
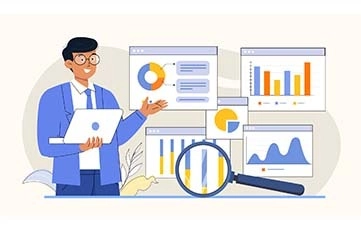
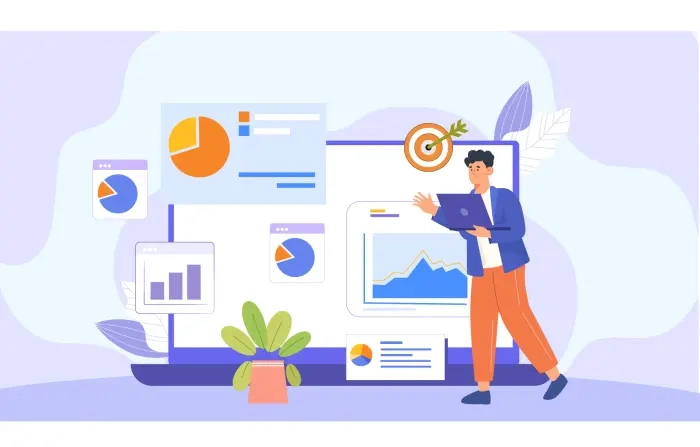
Get Creative And Eye Catching Data Analysis Illustrations and experience the transformative power of visually stunning data analysis illustrations. Our captivating visuals bring complex data to life, enabling you to make informed decisions with confidence. Discover the art of storytelling through data, backed by cutting-edge analytics. Explore our gallery today.
Get The Creative 2D Character Of Data Analysis Illustration data analysis with our creative 2D character illustrations. Transform complex information into visually engaging representations. Find the perfect visual elements to convey your data insights effectively.

A guy is shown analyzing real estate data and trends in the expertly done and educational artwork titled "The Man Analysis of Real Estate Vector Illustration." For real estate firms, property investment companies, or any project requiring the analysis and presentation of real estate data, this vector graphic is ideal.

Agriculture and technology as women embrace tablets for data analysis in this captivating illustration. Discover how innovative tools are empowering women in agriculture to make data-driven decisions and optimize farming practices.
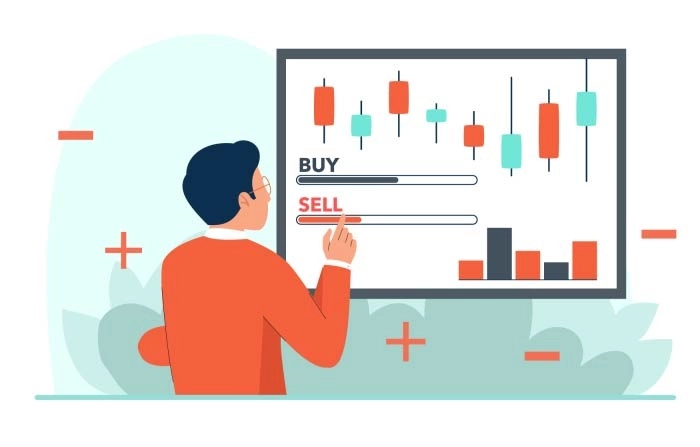
Learn the art of analyzing candlestick charts in the stock market as a trader. This comprehensive guide provides insights into reading and interpreting candlestick patterns, helping you make informed investment decisions. Master the skills needed to navigate the complexities of stock market trends and enhance your trading strategies.

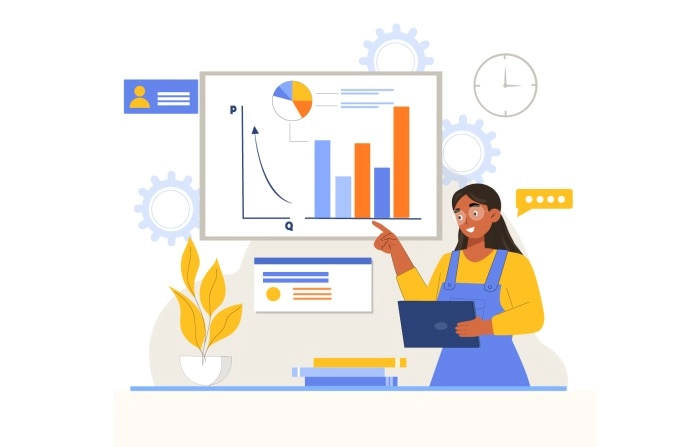
A vector illustration depicts a young, professional woman analyzing graph data on her laptop. Dressed in professional attire, she is engaged with the data, pointing at specific parts and holding a stylus. The illustration uses a clean, minimalist design style, showcasing her expertise in data analysis.

A flat character design illustration illustrates an SEO keyword focus scene, featuring a large screen with keyword data, search volumes, and analytics charts. Characters, digital marketers, and SEO specialists are depicted brainstorming, analyzing trends, and working on content strategies. The bold, modern color palette symbolizes creativity and data analysis.
The cartoon avatar illustration features a tech-savvy character embodying data analytics, dressed in casual yet smart attire. They wear eyeglasses, neat hairstyle, and a stylus, symbolizing their constant connection to data sources. Their upright posture and curiosity about data intricacies reflect their dedication to data analysis.
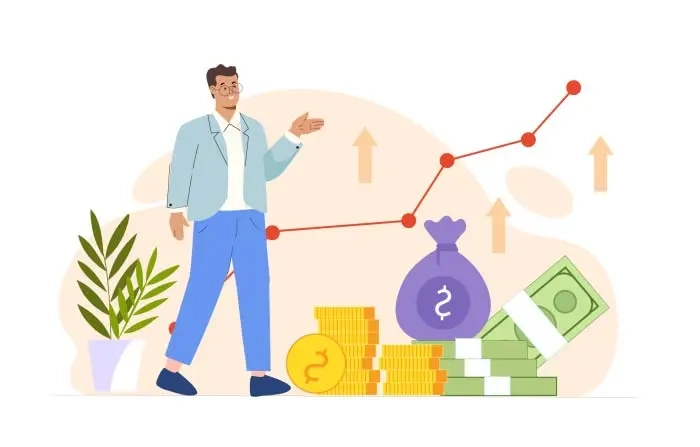
The illustration uses graphical elements to symbolize economic growth and progress, showcasing various sectors and prosperity. It uses a flat design style, vibrant colors, and a background of financial markets to convey optimism.
create a design in No time with our premium design assets
Personal Use License
24/7 customer support
Unlimited Pro design files
Content On Demand
80 premium items per month
Unlimited Free design files
20 premium items daily
Exclusive content
3D And CGI VFX Assets