
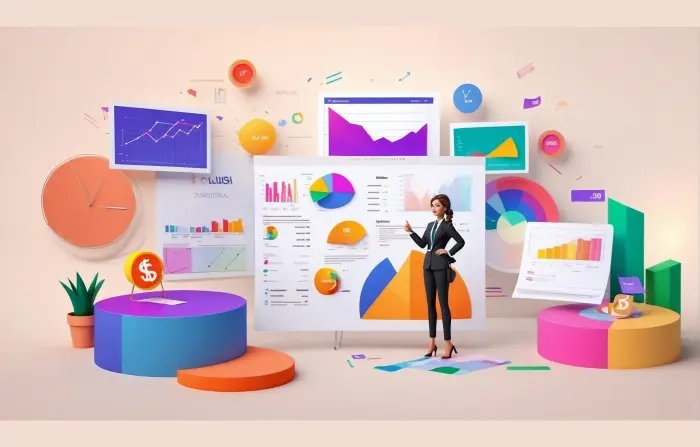
Business Growth and Analysis 3D Infographics Illustration
This 3D infographic illustrates business growth and analysis, using vibrant colors and intricate 3D structures. It highlights data-driven decision-making and provides a comprehensive overview of an organization's performance, making it an effective tool for corporate presentations.
Attributes
Size Resizable
File Format PNG
Software
Author
NinthMotion
OR
Discover Similar Templates
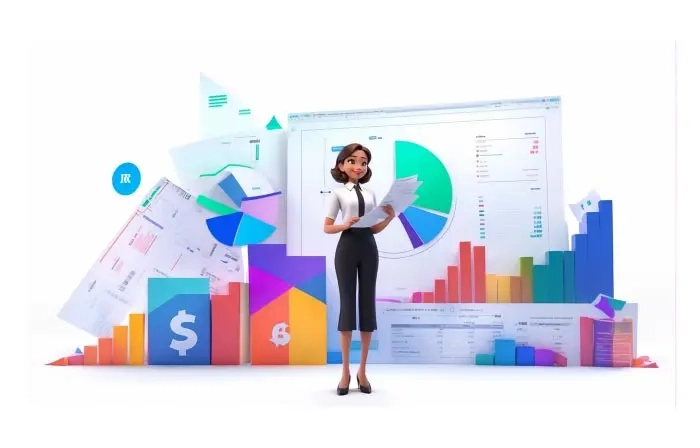
Our AI illustration showcases business trends through diverse characters in various scenarios, providing a visually appealing and user-friendly infographic. This infographic aids in making informed decisions and driving business forward, enhancing financial performance and market dynamics.

Create a visually appealing 2D business infographic for social media marketing, featuring vibrant colors, sleek design elements, and easy-to-read typography. Emphasize user engagement with dynamic elements, graphs, charts, and illustrative elements for comprehensibility and professionalism.
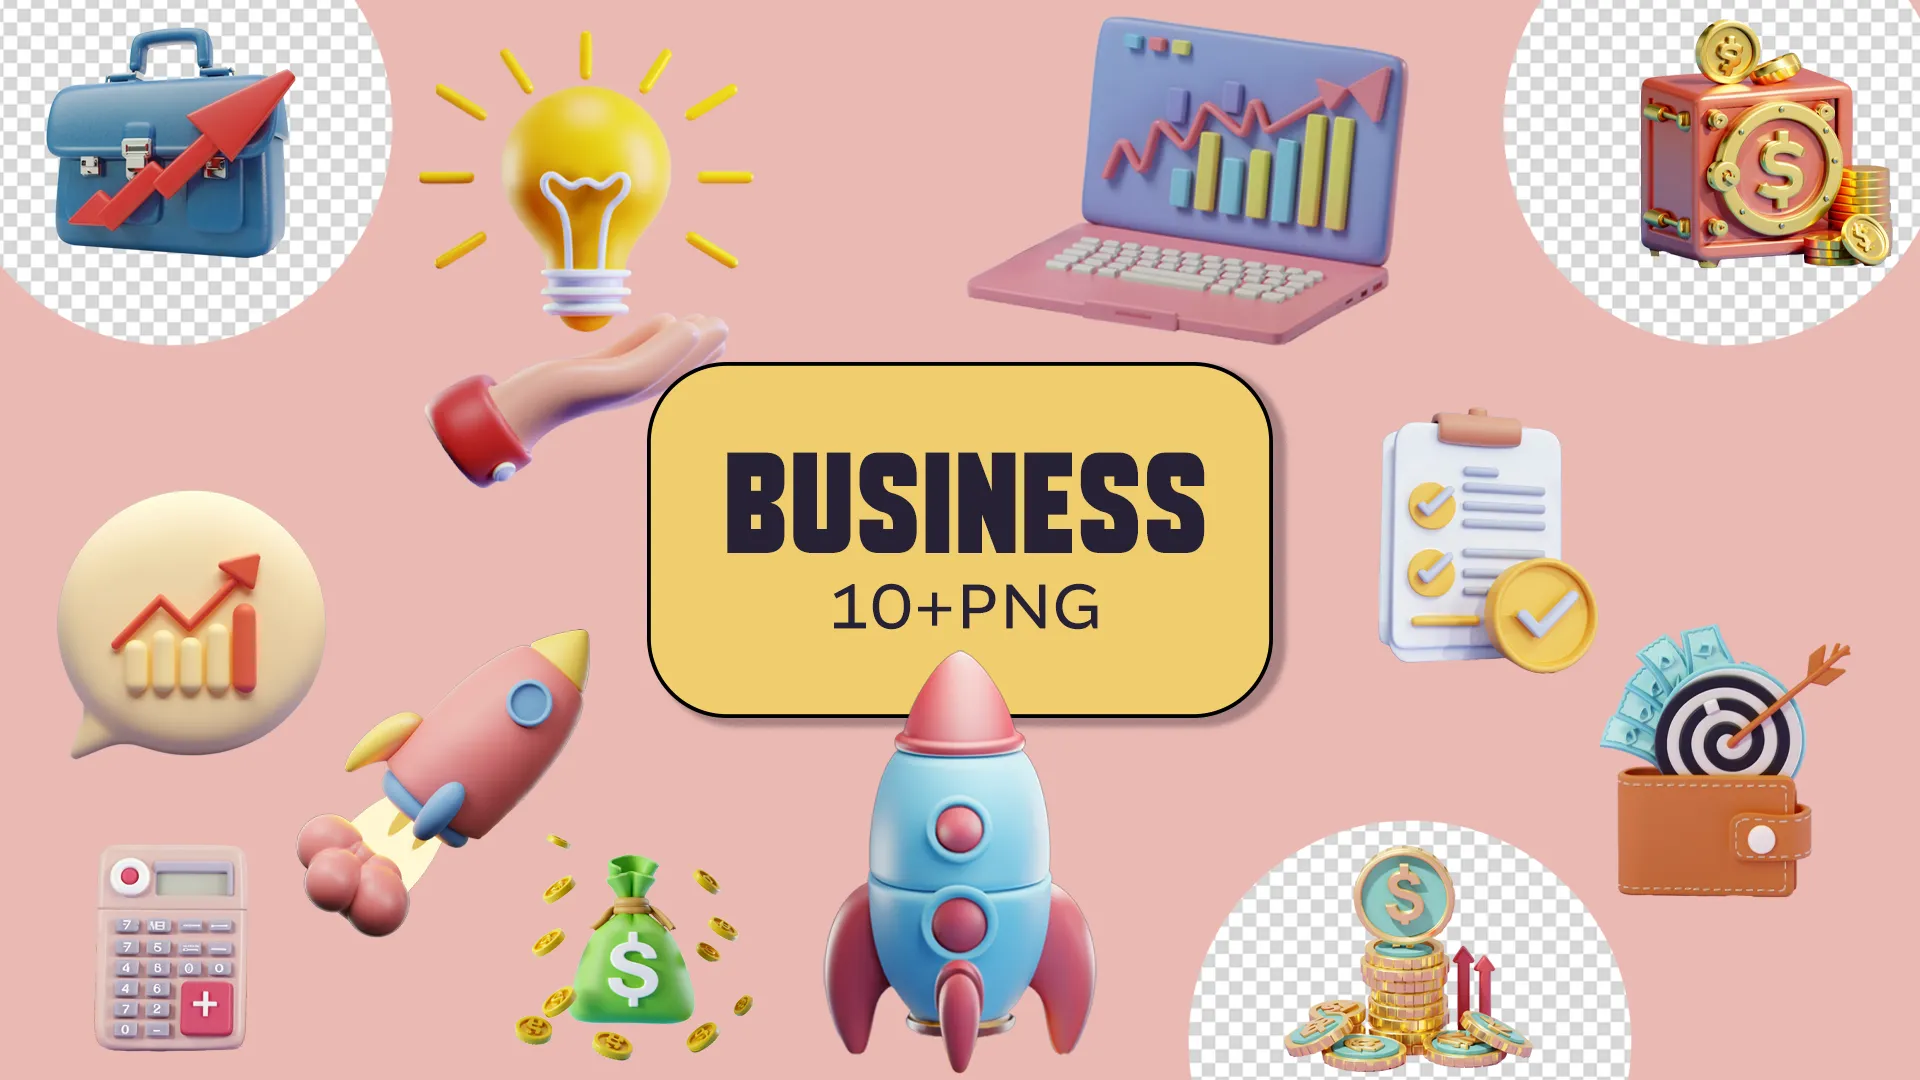
Unlock the potential for financial growth and success with our Business Analysis 3D Pack, meticulously designed to drive strategic insights and empower decision-making! Immerse yourself in a world of dynamic visuals with meticulously crafted 3D models of financial charts, graphs, and analytical tools. Whether you're conducting market research, evaluating performance metrics, or forecasting future trends, these versatile assets add depth and clarity to your business analysis.

The flat vector illustration and infographic depict an email service in action, showcasing its efficiency and user-friendliness. The design emphasizes organization and productivity, while the infographic provides key data and insights for optimizing email communication.

This flat vector illustration visually represents a business's growth analysis, using clean lines and a minimalist design. It uses graphical elements like line charts and pie charts to effectively communicate trends and strategies.

The 3D design illustrates smartphone app infographics, showcasing app categories, icons, and usage statistics. The infographic balances aesthetics and informative content, presenting data on app downloads, user demographics, and market share percentages. It effectively communicates the diversity of mobile apps.
Our AI illustration showcases business trends through diverse characters in various scenarios, providing a visually appealing and user-friendly infographic. This infographic aids in making informed decisions and driving business forward, enhancing financial performance and market dynamics.
Create a visually appealing 2D business infographic for social media marketing, featuring vibrant colors, sleek design elements, and easy-to-read typography. Emphasize user engagement with dynamic elements, graphs, charts, and illustrative elements for comprehensibility and professionalism.
Unlock the potential for financial growth and success with our Business Analysis 3D Pack, meticulously designed to drive strategic insights and empower decision-making! Immerse yourself in a world of dynamic visuals with meticulously crafted 3D models of financial charts, graphs, and analytical tools. Whether you're conducting market research, evaluating performance metrics, or forecasting future trends, these versatile assets add depth and clarity to your business analysis.
The flat vector illustration and infographic depict an email service in action, showcasing its efficiency and user-friendliness. The design emphasizes organization and productivity, while the infographic provides key data and insights for optimizing email communication.
This flat vector illustration visually represents a business's growth analysis, using clean lines and a minimalist design. It uses graphical elements like line charts and pie charts to effectively communicate trends and strategies.
The 3D design illustrates smartphone app infographics, showcasing app categories, icons, and usage statistics. The infographic balances aesthetics and informative content, presenting data on app downloads, user demographics, and market share percentages. It effectively communicates the diversity of mobile apps.