

Business Performance Growth Analysis Flat Vector Illustration
This flat vector illustration visually represents a business's growth analysis, using clean lines and a minimalist design. It uses graphical elements like line charts and pie charts to effectively communicate trends and strategies.
Attributes
Size Resizable
File Format EPS,SVG,JPEG
Software Adobe Illustrator
Author
NinthMotion
OR
Discover Similar Templates

Unlock the potential for financial growth and success with our Business Analysis 3D Pack, meticulously designed to drive strategic insights and empower decision-making! Immerse yourself in a world of dynamic visuals with meticulously crafted 3D models of financial charts, graphs, and analytical tools. Whether you're conducting market research, evaluating performance metrics, or forecasting future trends, these versatile assets add depth and clarity to your business analysis.

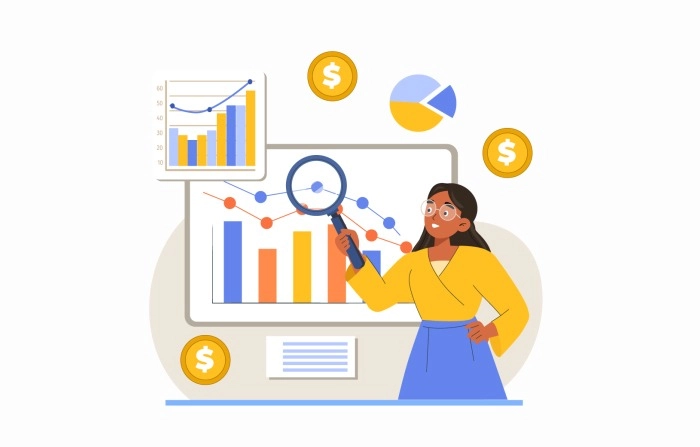
The "Growth Chart Analysis Female 3D Illustration" depicts a professional female character analyzing growth charts, showcasing her expertise in interpreting trends. This 3D illustration is suitable for various applications, including financial reports, business presentations, and marketing content.
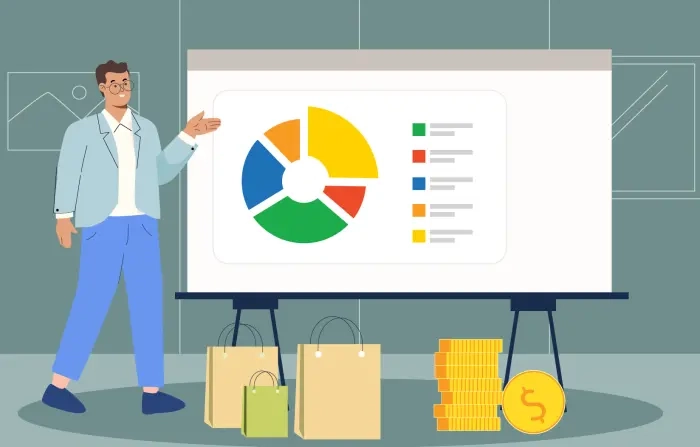
A "Flat Character Man Data Analysis and Sales Performance Graph Illustration" depicts a male character in a business setting, analyzing data and making informed decisions, often accompanied by charts and data visualizations, for various business applications.

Learn powerful Seo marketing concepts to boost your business's growth and reach new heights. Discover proven strategies, innovative techniques, and expert insights for attracting and retaining customers.
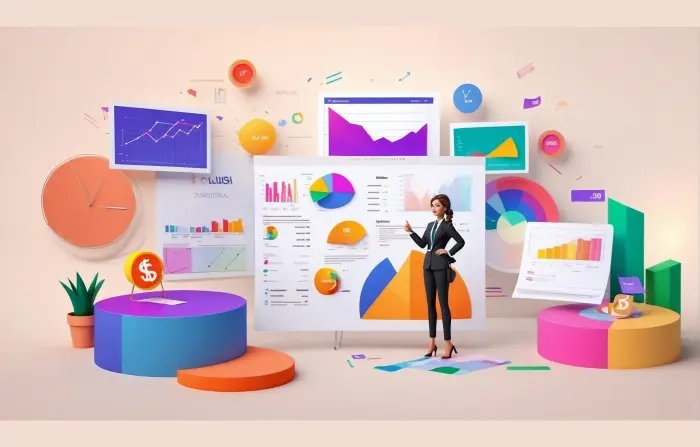
This 3D infographic illustrates business growth and analysis, using vibrant colors and intricate 3D structures. It highlights data-driven decision-making and provides a comprehensive overview of an organization's performance, making it an effective tool for corporate presentations.
Sales performance illustration is a visual representation of the sales performance of a company or a sales team over a specific period of time. It typically includes graphs, charts, and other visual aids that show the key sales metrics such as revenue, units sold, profit margin, customer acquisition, and retention rates.
Unlock the potential for financial growth and success with our Business Analysis 3D Pack, meticulously designed to drive strategic insights and empower decision-making! Immerse yourself in a world of dynamic visuals with meticulously crafted 3D models of financial charts, graphs, and analytical tools. Whether you're conducting market research, evaluating performance metrics, or forecasting future trends, these versatile assets add depth and clarity to your business analysis.
The "Growth Chart Analysis Female 3D Illustration" depicts a professional female character analyzing growth charts, showcasing her expertise in interpreting trends. This 3D illustration is suitable for various applications, including financial reports, business presentations, and marketing content.
A "Flat Character Man Data Analysis and Sales Performance Graph Illustration" depicts a male character in a business setting, analyzing data and making informed decisions, often accompanied by charts and data visualizations, for various business applications.
Learn powerful Seo marketing concepts to boost your business's growth and reach new heights. Discover proven strategies, innovative techniques, and expert insights for attracting and retaining customers.
This 3D infographic illustrates business growth and analysis, using vibrant colors and intricate 3D structures. It highlights data-driven decision-making and provides a comprehensive overview of an organization's performance, making it an effective tool for corporate presentations.
Sales performance illustration is a visual representation of the sales performance of a company or a sales team over a specific period of time. It typically includes graphs, charts, and other visual aids that show the key sales metrics such as revenue, units sold, profit margin, customer acquisition, and retention rates.