
EXCLUSIVE OFFER
Get Unlimited Downloads With a Commercial License Starting at just $3.99 per month!
Graphic Design Stock Market Analysis Templates - Page 2
Discover our extensive collection of graphic design Stock Market Analysis templates on Page 2, and find the perfect match for your creative vision. From business cards to promotional flyers, our designs cater to a wide variety of graphic needs.

Business Data Analyst Character Illustration, a professional and modern representation of a skilled data analyst. This character illustration is designed to add a human touch to your data-driven presentations, reports, and marketing materials, making complex information more approachable and engaging for your audience.

The Business Startup Concept Illustration is a visually engaging and dynamic illustration that represents the concept of starting a new business. It showcases key elements and stages involved in the process, capturing the excitement and potential of embarking on a new entrepreneurial journey.

Dive into the world of finance with our Girl Analyzing Stock Market at Computer 3D Character Design Illustration Template. This dynamic illustration showcases a girl immersed in the intricacies of the stock market, studying data on her computer screen. Elevate your financial presentations, investment guides, or educational materials with this engaging illustration, inspiring insight and strategic thinking among your audience. Embrace the complexities of finance with this versatile template, inviting viewers to explore the exciting world of stock analysis.

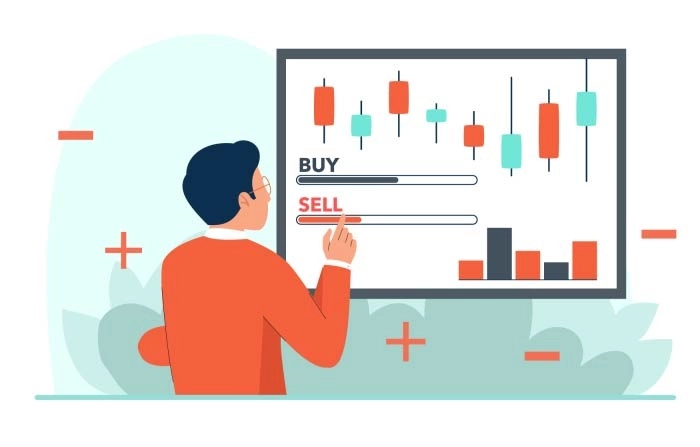
Explore our captivating vector illustration depicting the seamless process of buying and selling stocks directly from mobile devices. Witness the convenience and accessibility of stock trading at your fingertips

A data-analyzing concept flat character illustration portrays a professional in a clean, modern setting, equipped with tools like laptops, charts, and graphs. Their serious expression and thoughtful facial expression reflect their analytical nature, emphasizing the importance of data analysis for informed decision-making.

Enhance your investment analysis materials with this dynamic stock illustration template featuring characters. With a blend of professionalism and visual appeal, this template provides a captivating way to present investment analysis concepts. Whether for reports, presentations, or online content, it adds depth and clarity to your analysis, helping your audience understand investment strategies and insights effectively.
Learn the art of analyzing candlestick charts in the stock market as a trader. This comprehensive guide provides insights into reading and interpreting candlestick patterns, helping you make informed investment decisions. Master the skills needed to navigate the complexities of stock market trends and enhance your trading strategies.

The illustration depicts a professional flat vector character in a data analytics presentation, surrounded by graphs, charts, and data-related visuals. The character's professionalism and expertise are emphasized, with a clean, comprehensible presentation style. This illustration is ideal for presentations, reports, or educational materials.

Learn powerful Seo marketing concepts to boost your business's growth and reach new heights. Discover proven strategies, innovative techniques, and expert insights for attracting and retaining customers.

This vector illustration features a girl explaining the sales performance to her colleague or team members. The girl is standing in front of a whiteboard or a screen, pointing at the graph or chart that represents the sales performance. She is wearing professional attire, with a blazer and a skirt, indicating that she is a business professional.

Unlock success with effective marketing strategies. Learn how to attract customers, build brand loyalty, and optimize your online presence. Leverage SEO meta descriptions and keywords for improved visibility and organic search rankings

A flat character illustration of a girl explaining sales performance could depict a young woman in business attire, standing in front of a chart or graph that displays sales data. The illustration would aim to highlight the character's ability to communicate and analyze sales performance.
create a design in No time with our premium design assets
Personal Use License
24/7 customer support
Unlimited Pro design files
Content On Demand
80 premium items per month
Unlimited Free design files
20 premium items daily
Exclusive content
3D And CGI VFX Assets