
EXCLUSIVE OFFER
Enjoy 50% off on all purchases and subscriptions, available with any payment method!
Transform Your Creative Work: Start Today with Our free default graphics statistics design Templates
Explore the ultimate collection of free default graphics statistics design to transform your brand visuals. Dive into a world of premium designs that are both trendy and effortless to use. Elevate your video projects with our captivating templates and make your brand stand out.
Filter By:
free
The 3D cartoon character illustrates the process of analyzing and interpreting data from a growth chart, using vibrant colors and expressive facial features. This engaging and informative illustration is suitable for educational and research presentations.
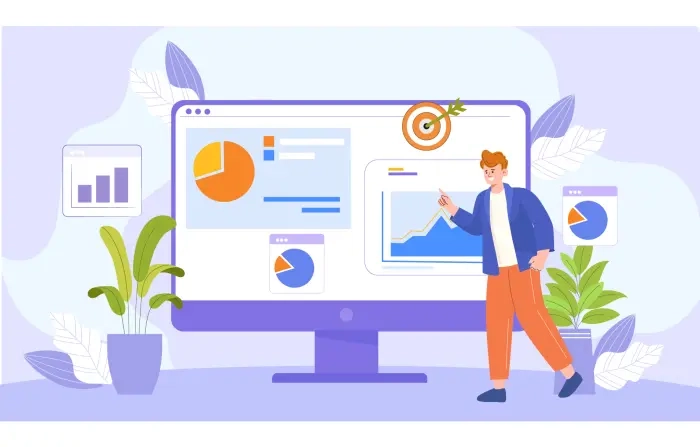
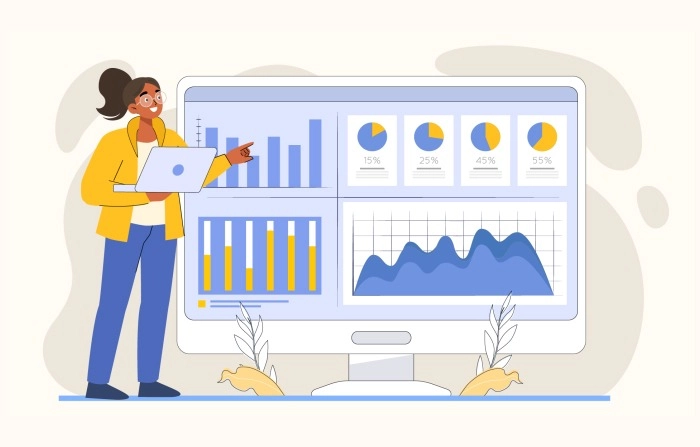
A data-analyzing concept flat character illustration portrays a professional in a clean, modern setting, equipped with tools like laptops, charts, and graphs. Their serious expression and thoughtful facial expression reflect their analytical nature, emphasizing the importance of data analysis for informed decision-making.
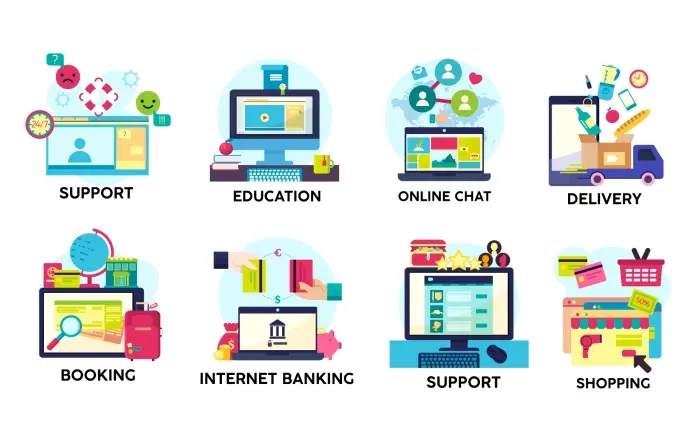
The set of infographics elements illustration includes customizable graphics, charts, icons, and text placeholders that can be easily edited to suit your specific needs. You can adjust the colors, sizes, and styles of the elements to match your branding or desired visual aesthetic.

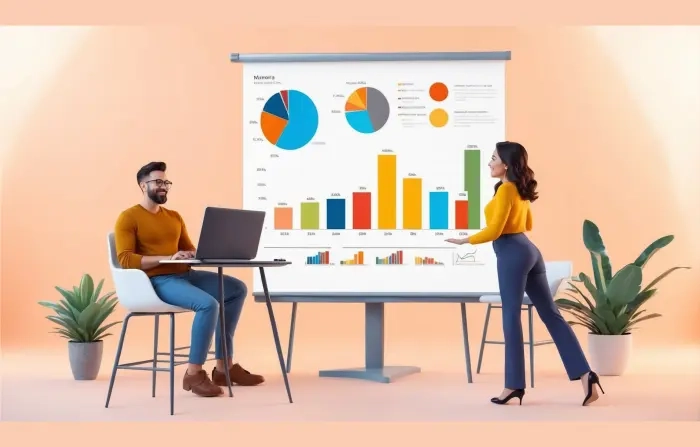
Business infographics and 3D character illustrations provide a visually appealing way to convey complex business concepts and statistics. The infographics use charts, graphs, and icons, while the 3D character adds a human touch, enhancing the effectiveness of business communication and storytelling.

online shopping experience with our comprehensive collection of infographics elements. Illustrate key concepts and statistics to inform and engage your audience.

This email marketing flat character and statistical infographics illustration visually represents the dynamic world of email marketing, featuring diverse characters representing roles and metrics. The combination of characters and infographics highlights the human and data-driven aspects of the industry.

The email service flat character and infographic presentation illustrate a clean, modern workspace, with a professional, focused user. The infographic provides a visual representation of email statistics, enhancing efficiency and organization.
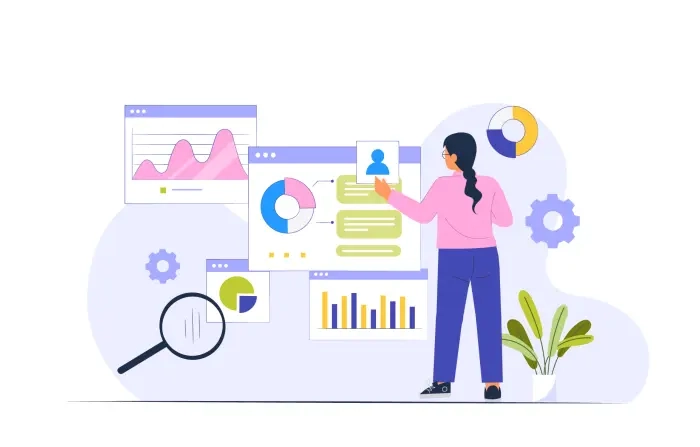
Female Data Analyzing on Pie Chart Illustration, we see a visually striking and informative representation of data analysis focused specifically on female-related statistics. This illustration aims to provide a clear and concise visual summary of data pertaining to women, empowering viewers with valuable insights and knowledge.
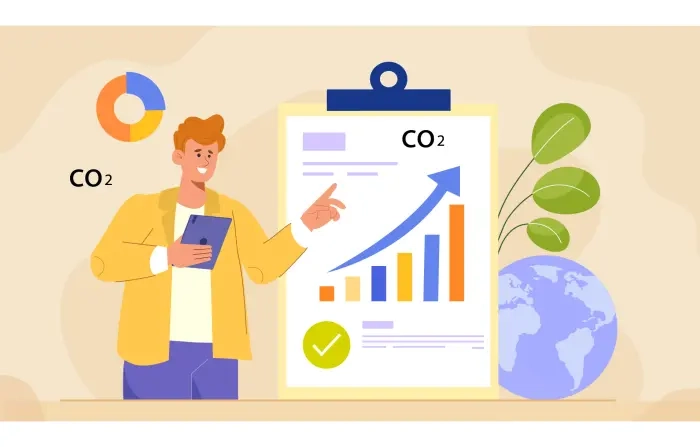
The concept illustration for a graph illustrating global warming and CO2 emissions highlights the increasing levels of carbon dioxide emissions, emphasizing the urgent need for environmental action and serves as a powerful tool for raising awareness and promoting action.
Explore our collection of high-quality vector illustrations depicting the process of data analysis. These illustrations showcase the various stages involved in analyzing and visualizing data, providing a visual representation of complex data sets
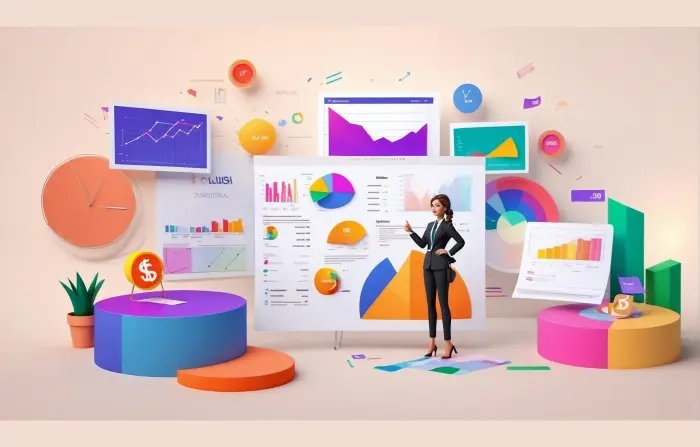
This 3D infographic illustrates business growth and analysis, using vibrant colors and intricate 3D structures. It highlights data-driven decision-making and provides a comprehensive overview of an organization's performance, making it an effective tool for corporate presentations.
create a design in No time with our premium design assets
Personal Use License
24/7 customer support
Unlimited Pro design files
Content On Demand
80 premium items per month
Unlimited Free design files
20 premium items daily
Exclusive content
3D And CGI VFX Assets